Insert Visual Breaks Between Groups in a Column...
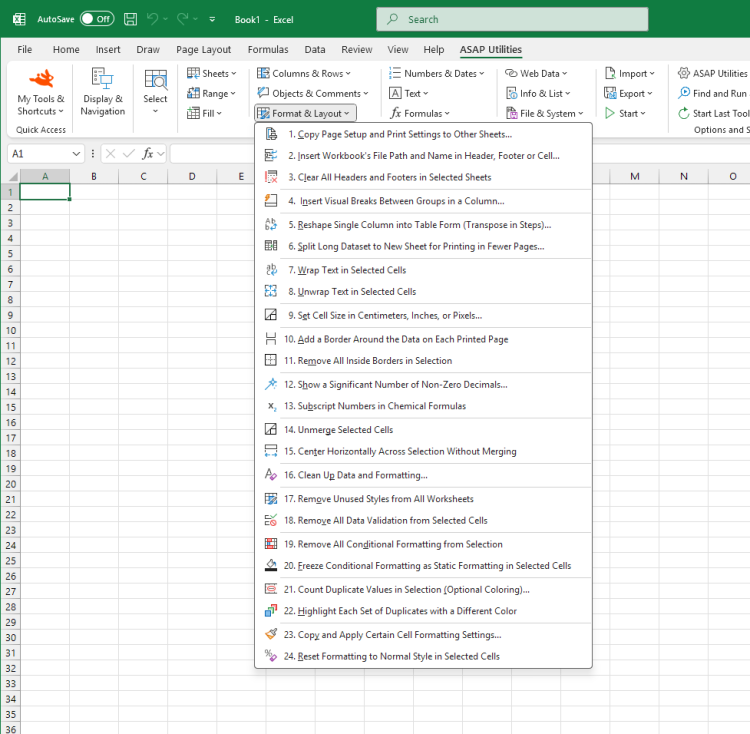
ASAP Utilities › Format & Layout › 4. Insert Visual Breaks Between Groups in a Column...This tool makes it easy to visually separate groups of rows based on repeating values in a column.
It analyzes one column in your selection, detects where the value changes, and then inserts visual formatting to highlight the group breaks. You can choose to insert:
· Customize style, thickness, and color
· Apply to the current table or region or the entire row
· Optionally remove existing formatting first
· Apply to the current table or region or the entire row This makes your data easier to scan, present, or print. Examples of use:
Screenshots
Example screenshot: 1 Insert an empty row between groups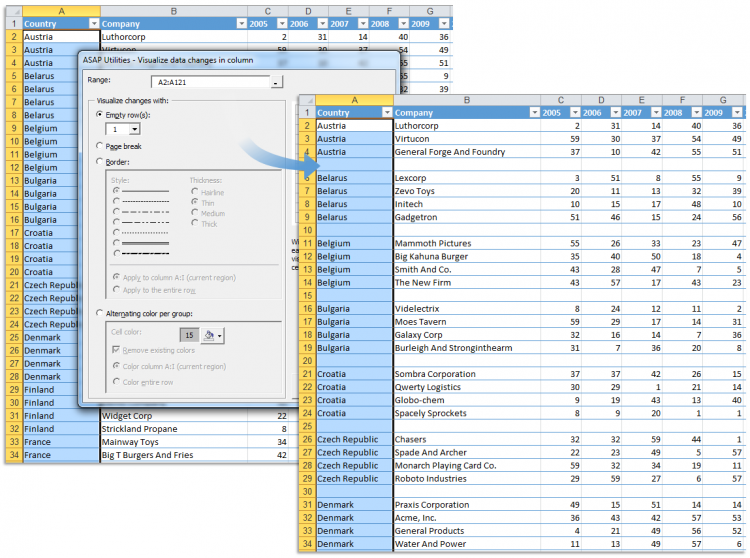
Example screenshot: 2 Insert a pagebreak between groups
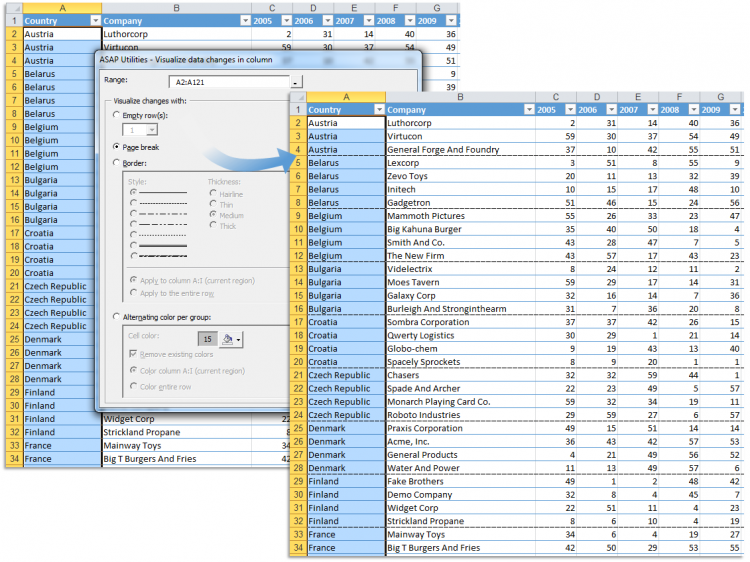
Example screenshot: 3 Insert a border line between groups
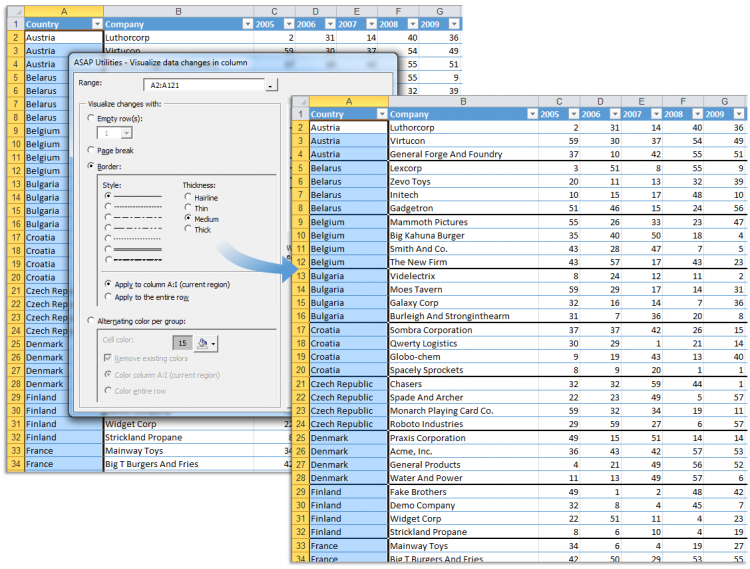
Example screenshot: 4 Color banding per group
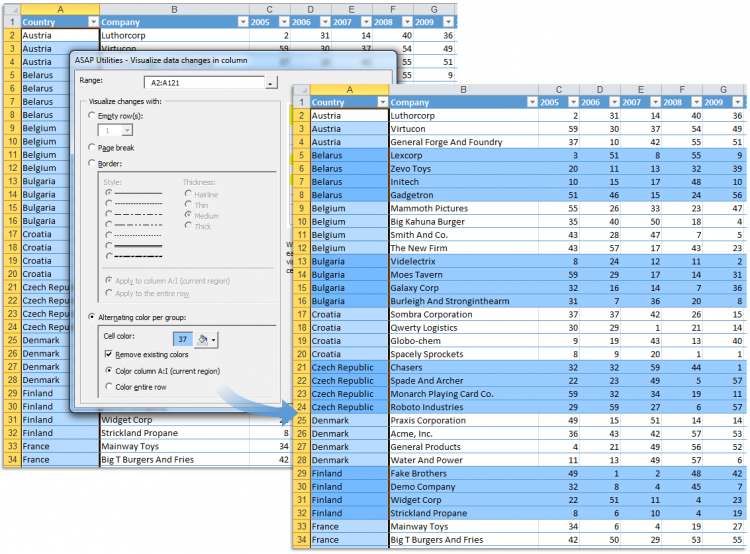

Practical tricks on how this can help you
Practical 'real world' examples on our blog that show you how this tool can help you in Excel. Enjoy!Starting this tool
- Click ASAP Utilities › Format & Layout › 4. Insert Visual Breaks Between Groups in a Column...
- Specify a Keyboard Shortcut: ASAP Utilities › My Tools & Shortcuts › Manage My Tools & Shortcuts...
Additional keywords for this tool:
Highlight group breaks in Excel, Insert row after value change, Separate groups in column, Visual breaks between data groups, Detect value change in column, Insert blank row between repeating values, Alternating colors for grouped rows, Group formatting, Insert page break when value changes, Column formatting by group, Separate repeated values visually, Formatting on value change, Break on duplicate values, Highlight row groups, Insert row after group change, Auto format groups, Group data visually, Format table by value change, Visually split data in Excel, Insert line after each group
Highlight group breaks in Excel, Insert row after value change, Separate groups in column, Visual breaks between data groups, Detect value change in column, Insert blank row between repeating values, Alternating colors for grouped rows, Group formatting, Insert page break when value changes, Column formatting by group, Separate repeated values visually, Formatting on value change, Break on duplicate values, Highlight row groups, Insert row after group change, Auto format groups, Group data visually, Format table by value change, Visually split data in Excel, Insert line after each group
Choose your language preference below
English (us) ⁄ Nederlands ⁄ Deutsch ⁄ Español ⁄ Français ⁄ Português do Brasil ⁄ Italiano ⁄ Русский ⁄ 中文(简体) ⁄ 日本語
| Clear All Headers and Footers in Selected Sheets |
©1999-2026 ∙ ASAP Utilities ∙ A Must in Every Office BV ∙ The Netherlands
🏆 Winner of the "Best Microsoft Excel Add-in" Award at the Global Excel Summit 2025 in London!
For over 26 years, ASAP Utilities has helped users worldwide save time and do what Excel alone cannot.
🏆 Winner of the "Best Microsoft Excel Add-in" Award at the Global Excel Summit 2025 in London!
For over 26 years, ASAP Utilities has helped users worldwide save time and do what Excel alone cannot.
